US House Prices 2019 to 2021 Trend Forecast (3/3) Dear Reader, This is part 3 of 3 of my US housing market analysis that concludes in a detailed multi-year trend forecast that covers the following in bold
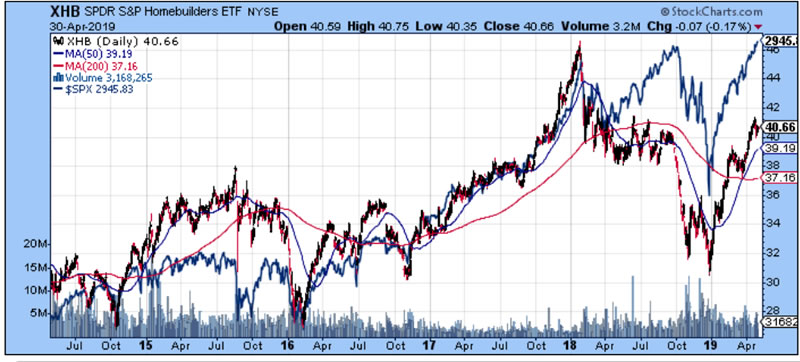
However the whole of this analysis was first been made available to Patrons who support my work: https://www.patreon.com/posts/us-house-prices-26484438 So for immediate First Access to ALL of my analysis and trend forecasts then do consider becoming a Patron by supporting my work for just $3 per month. https://www.patreon.com/Nadeem_Walayat. US Housing Market Demographics Similar demographics are playing out across the western world, as I recently extensively covered for the UK housing market (UK Ageing Population Demographics and House Prices Trend Forecast ). Namely that baby boomers are attempting to downsize from their large high priced family homes onto the next generation's who basically cannot afford to buy which should thus continue to depress the upper end of the US housing market whilst supporting the bottom to middle end which is all that the likes of Generation X and the Millennial's can afford to buy. In terms of house prices this will clearly dampen house prices inflation in affluent areas of the big cities whilst supporting the cheaper commuter belts around major cities. US Home Builders Index (XHB) The XHB chart shows that US home builder stocks have been significantly under performing against the S&P since April 2018. With little signs of change in the deviation in the trend, as the S&P trades towards new all time highs the XHB is a good 15% below its early 2018 high. All of which confirms that the stock market is discounting US housing market weakness that is only recently starting to be reflected in the house prices indices. And given that US house prices are likely to briefly go negative then that should convert into the XHB trading to new lows below $30 (current $40.66)
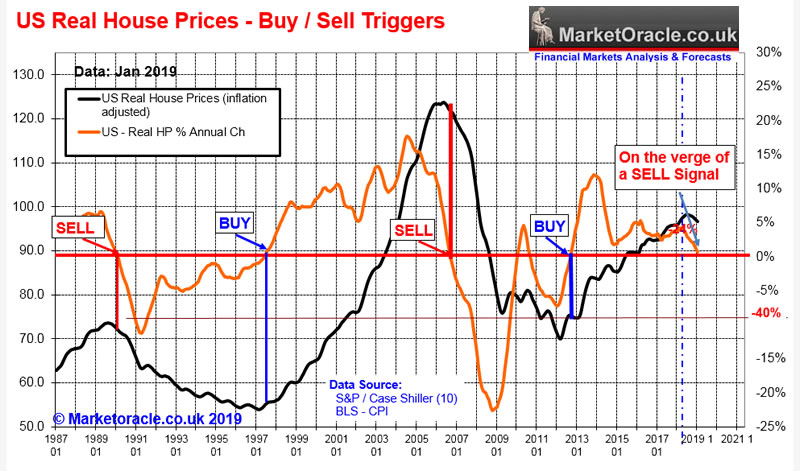
US Housing Market Real Terms BUY / SELL Indicator My analysis has so far painted an overall bullish picture for US house prices albeit at a slower pace than the 5% or so of recent years. However, my primary indicator on the health of the US housing market that has proven accurate for literally decades! Catching every major bull and bear market of the past 30 years! From it's first SELL signal in 1990 to it's last BUY in 2012, is once more warning that real terms house prices are about to go NEGATIVE!
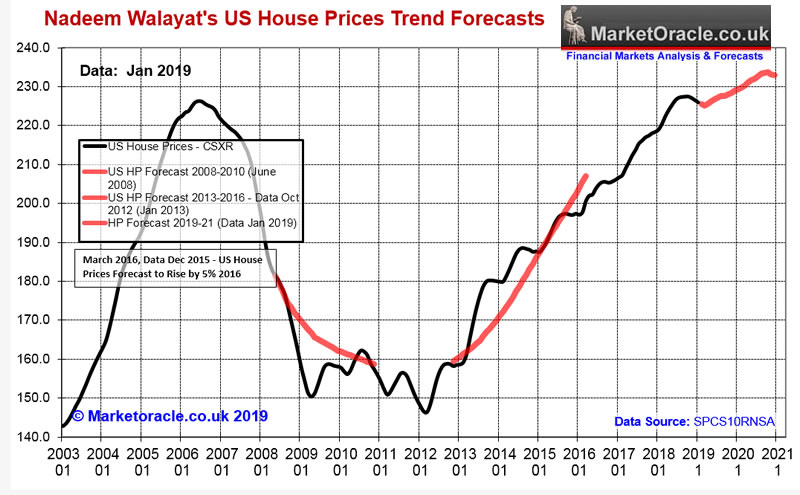
The latest published data for January 2019 has real terms house prices momentum declining to just +0.7% from +1.2% the month before, which means that we could be as little as 2 months away from triggering a SELL SIGNAL for US HOUSE PRICES for March 2019 data. Yes, no indicator will ever be 100% reliable, after all there was an early false buy signal in 2010, with the actual low coming in about 18 months later. Though only marginally lower. Perhaps we will see a similar pattern this time around, i.e. an early false SELL with the MAIN SELL signal coming in late 2020 or early 2021. However my primary US house prices indicator should not be ignored and it is giving an EARLY WARNING. And given my earlier momentum analysis I don't need to wait for March data to be released to know that house prices momentum will continue to decline for several more months. Which means the the US House Prices Real terms SELL SIGNAL WILL SOON BE TRIGGERED! Formulating a US House Prices Forecast Momentum , economic and trend analysis paints an overall bullish picture for US house prices, one of first a continuation of the correction coming into 2019 that resolves in a resumption of the bull run into the end of 2020 that was targeting house price inflation of about +7% over these 2 full years of data into early 2021. Which would convert into the Case Shiller 10 city Index (SPCS10RNSA ) rising from 225.9 (Jan 2019 data) to about 242 (Jan 2021 data). However, against this we have a near certain Imminent real terms SELL Signal, that implies to expect a much tougher 2019 and a shallower bounce into the end of 2020, which will likely see house prices entering into a significant down trend going into 2021. So US house prices will be lucky to achieve even half 7%. US House Prices 2019 to 2021 Trend Forecast Conclusion Therefore my forecast conclusion is for a relatively weak continuation of the US housing bull market into late 2020 at a much shallower pace than experienced in recent years for a likely gain of just 3% over the next 2 years (Jan 2019 to Jan 2021) before entering into a downtrend going into 2021 i.e. Case Shiller 10 city Index (SPCS10RNSA ) rising from 225.9 (Jan 2019 data) to 232.4 (Jan 2021 data) as illustrated by my trend forecast graph.
Peering into the Mists of Time Standing here in April 2019, late 2020 and 2021 look set to be a tough time for the US economy, house prices, and the stock market, markets that tend to discount the future i.e. not wait for GDP to start falling before they take a tumble. Which is good because any drops in target stocks will provide another opportunity to invest in the machine intelligence mega-trend. The whole of this analysis was first made available to Patrons who support my work: https://www.patreon.com/posts/us-house-prices-26484438 So for First Access to ALL of my analysis and trend forecasts then do consider becoming a Patron by supporting my work for just $3 per month. https://www.patreon.com/Nadeem_Walayat. Scheduled Analysis :
Your analyst Nadeem Walayat Copyright © 2005-2019 Marketoracle.co.uk (Market Oracle Ltd). All rights reserved. Nadeem Walayat has over 30 years experience of trading derivatives, portfolio management and analysing the financial markets, including one of few who both anticipated and Beat the 1987 Crash. Nadeem's forward looking analysis focuses on UK inflation, economy, interest rates and housing market. He is the author of five ebook's in the The Inflation Mega-Trend and Stocks Stealth Bull Market series that can be downloaded for Free.
Disclaimer: The above is a matter of opinion provided for general information purposes only and is not intended as investment advice. Information and analysis above are derived from sources and utilising methods believed to be reliable, but we cannot accept responsibility for any trading losses you may incur as a result of this analysis. Individuals should consult with their personal financial advisors before engaging in any trading activities.
You're receiving this Email because you've registered with our website. How to Subscribe Click here to register and get our FREE Newsletter To access the Newsletter archive this link Forward a Message to Someone this link To update your preferences this link How to Unsubscribe - this link
The Market Oracle is a FREE Financial Markets Forecasting & Analysis Newsletter and online publication. | ||||||||||||||